
What’s Covered
Click to jump to your area of interest or scroll to read full report summary
Executive Review

Executive Review by Group CEO Paul Fineman and Group CFO Giles Willits.
The Group is again pleased to deliver double digit growth for the first half of the year, with revenue increasing 21% compared to the same period last year to £248.4 million (H1 2019: £205.2 million) driving a 21% increase in adjusted operating profit to £23.6 million (H1 2019: £19.4 million). Adjusted profit before tax was up 14% on the prior year period to £21.5 million (H1 2019: £18.9 million). This strong financial performance has been driven through organic growth and the full year effect of the Impact Innovations Inc. (‘Impact’) acquisition in the prior year and ensures we enter the second half with good momentum and a confident outlook for the full year.
Our performance continues to be underpinned by our focus on the Group’s strategy of ‘working with the winners’ to produce high quality products with innovative designs, while benefiting from scale and efficiency.
Reported profit before tax at £17.1 million was 22% up on the prior year (H1 2019: £14.0 million).
Average leverage improved to 1.0 times for the twelve month period ending 30 September 2019 from 1.3 times in the comparative period in 2018. Net debt at the half year was £86.2 million (H1 2019: £100.0 million), £13.8 million lower than last half year, largely driven by the improved opening cash position at the beginning of the financial year.
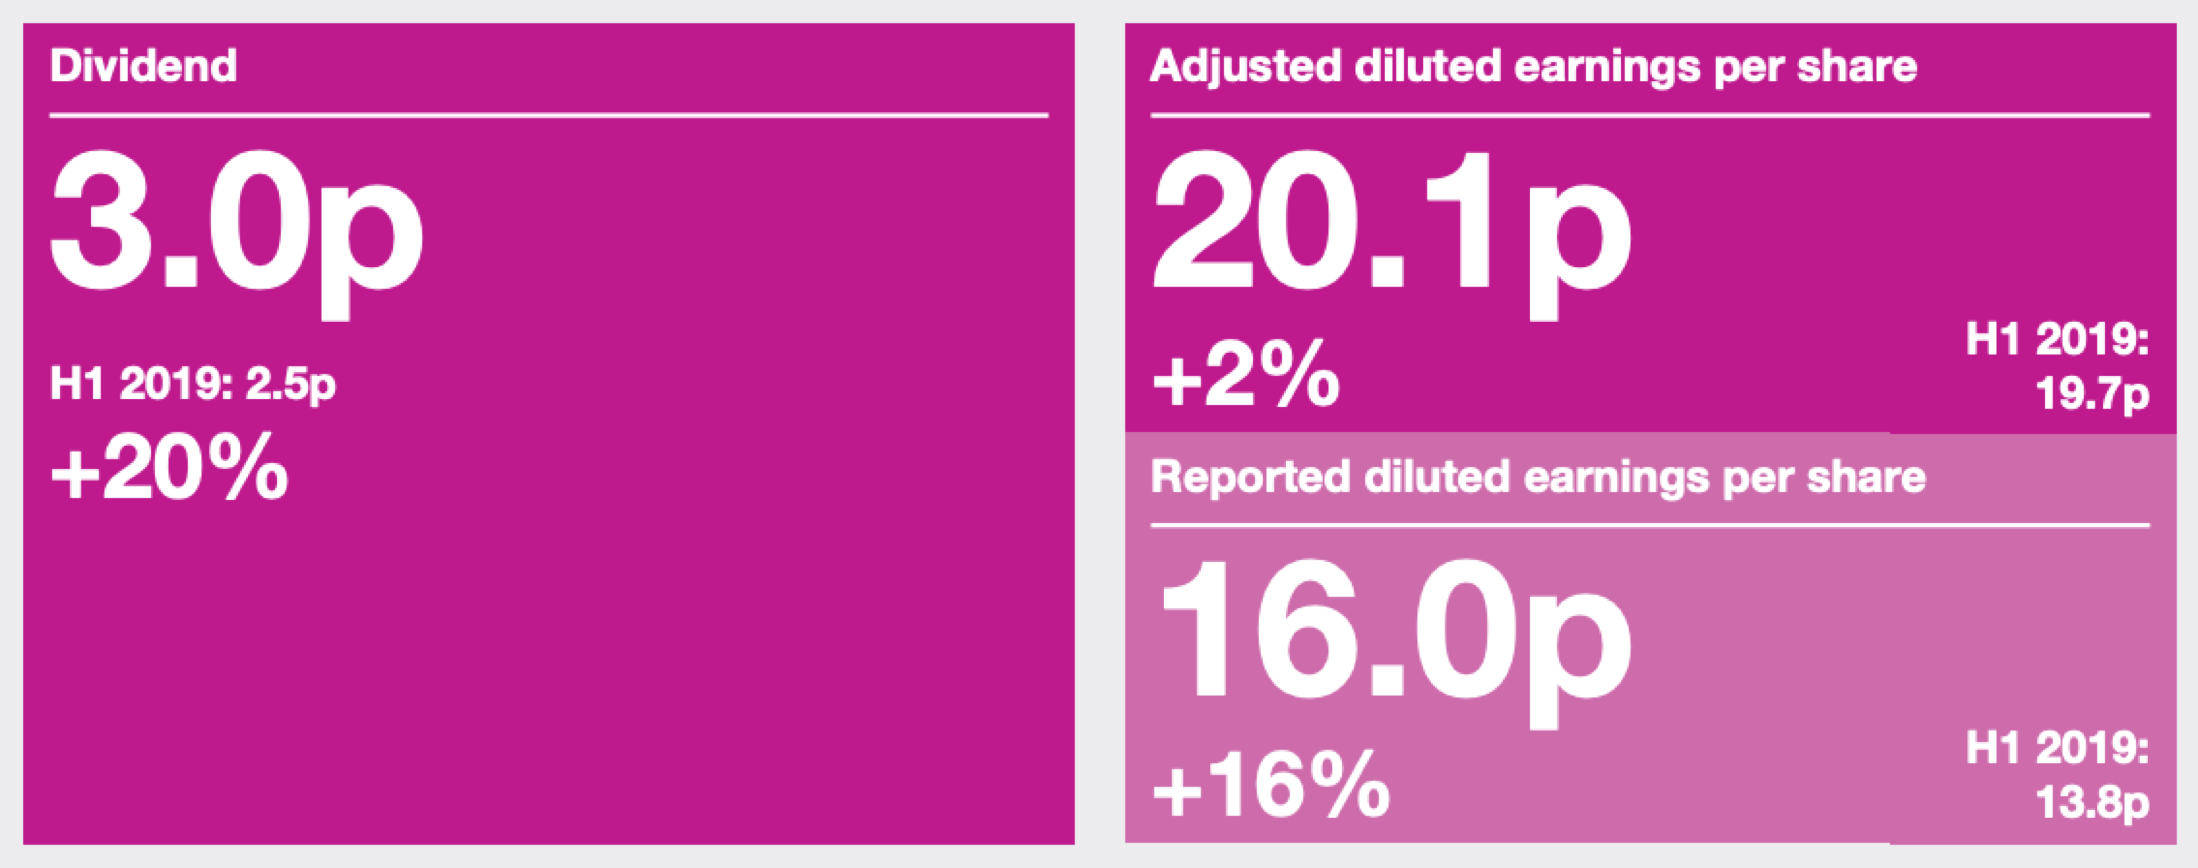
Key Financial Performance Indicators


Design Group at a Glance
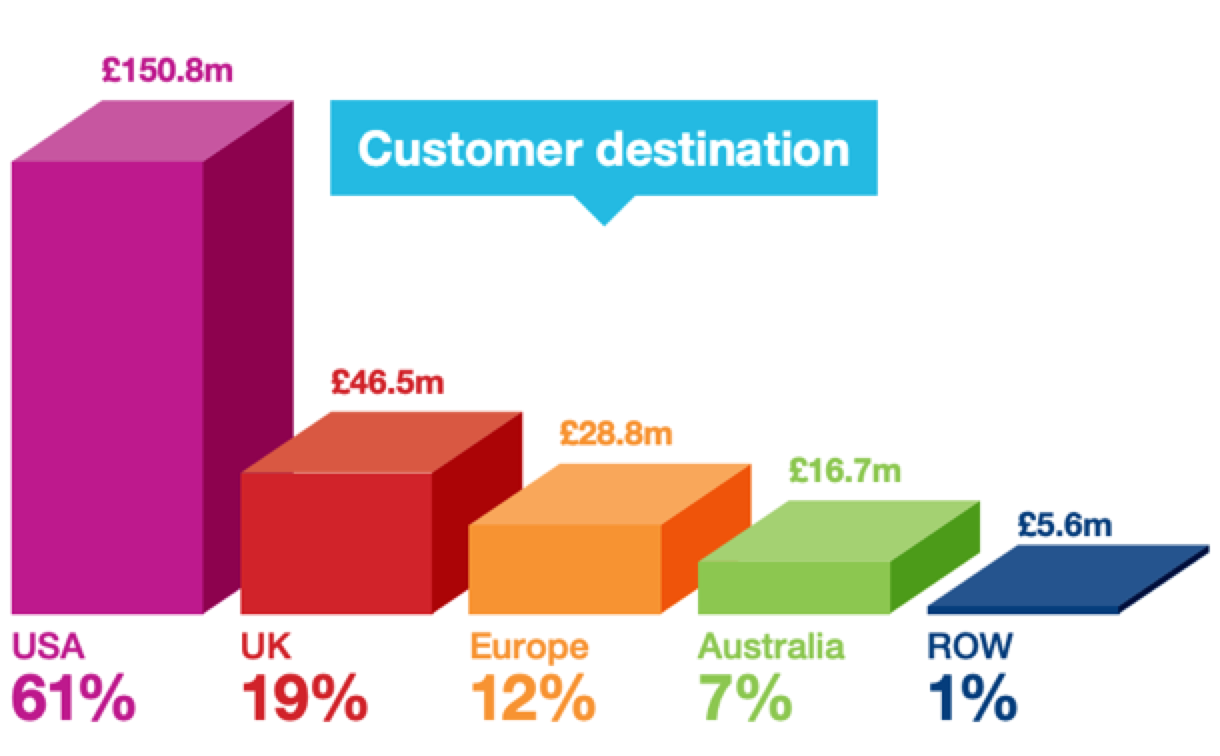
We’re truly international, with 11,000 customers selling our products through over 210,000 stores across more than 80 countries, we enjoy considerable market presence around the world.
Focused on our four major product categories of Celebrations, Stationery and creative play, Gifting and ‘Not‑for‑resale’ consumables, we leverage our Group size and expertise whilst retaining local market knowledge and relationships through our local businesses
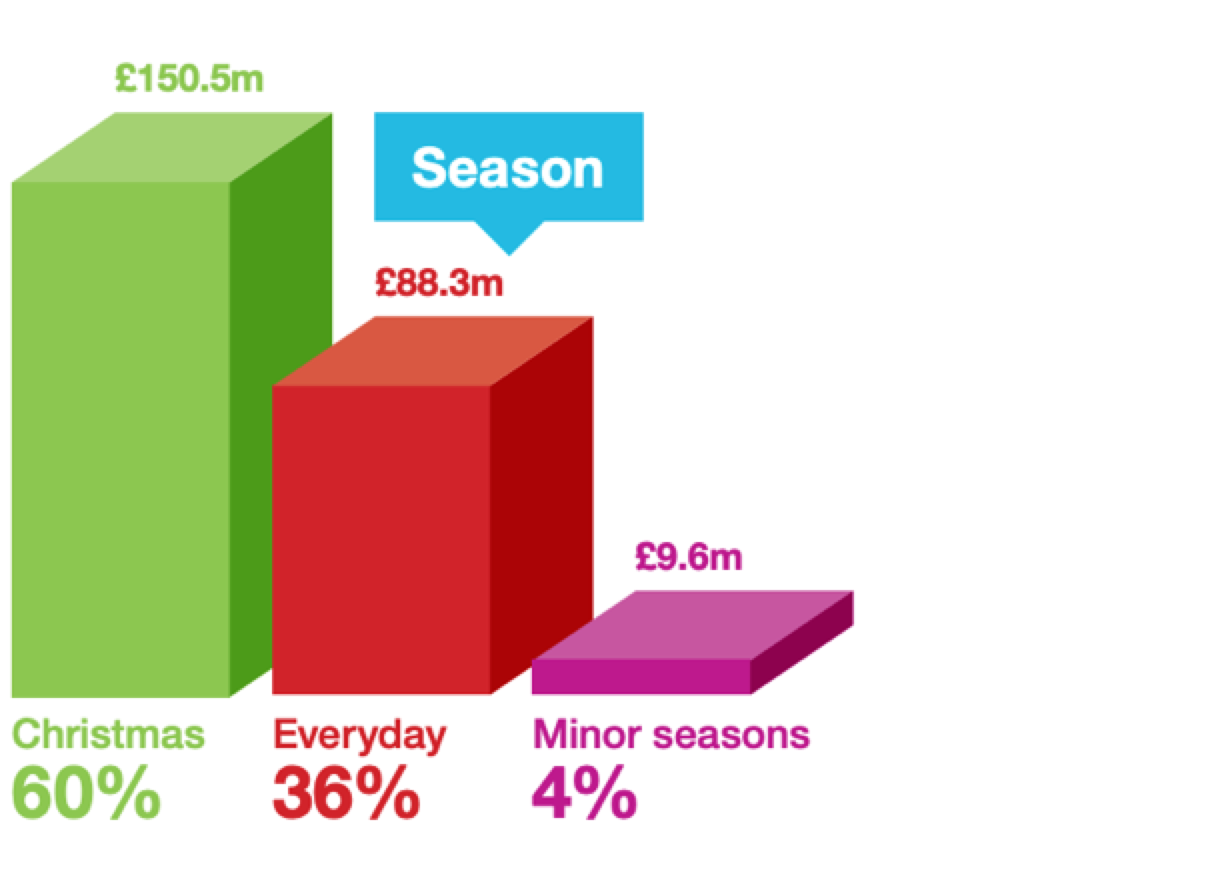
Revenue(a) By:


This blend of global scale and local knowledge allows us to offer our customers a high quality ‘one-stop-shop’ solution from small independents to large multinational retailers and e-tailers. In addition to our own generic brands, our design-led product offerings include an excellent portfolio of licensed and customer bespoke products.