IG Design Group Plc 2020 Half Year Results
An update on helping people celebrate life’s special occasions and inspiring individuals’ creativity. Download Interim Report.
What’s Covered
Click to jump to your area of interest or scroll to read full report summary
Executive Review
Watch: Half Year Results Video
Results Highlights
Our Business at a Glance
Watch: Half Year Results Presentation
Downloads
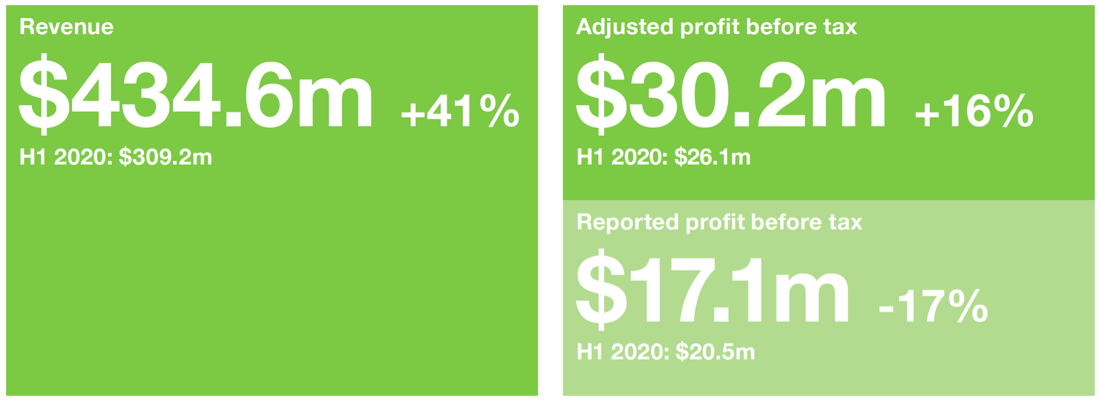
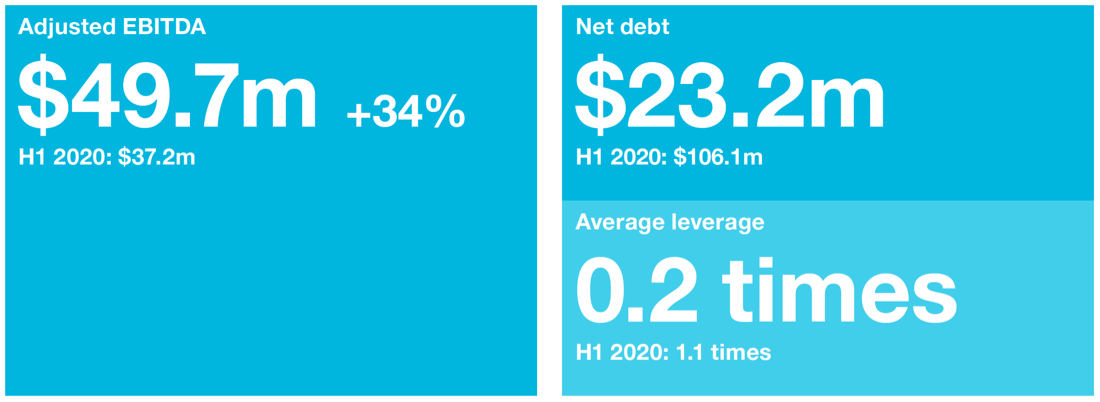
STRONGER THAN EXPECTED H1 PERFORMANCE – FULL YEAR OUTLOOK AHEAD OF MARKET EXPECTATIONS
In what has been an unprecedented period, what has shone through is the resilience and agility of our teams and our businesses. Together, we have managed to overcome numerous challenges in order to continue the delivery of quality products to our customers. Their skills and hard work have secured a strong performance and we take this opportunity to again thank them.
Though it has become more difficult for many to gather together it is pleasing to see that people’s desire to celebrate life’s special occasions has not waned despite the current circumstances. We’ve also seen countless families embracing at-home activities such as sewing or crafting. Similarly, Christmas in 2020 is being enthusiastically anticipated with customers reporting strong sell-through of decorations, gift packaging and crackers.
The outlook is encouraging, although we remain aware of continued global and regional challenges. Thanks to the strength of our performance in this half, together with our strong future pipeline, we are now tracking to deliver a full year performance ahead of market expectations.
Group CEO
Group CFO
Download 2020 Half Year Results

Watch
Half Year Results Video
Interim Report
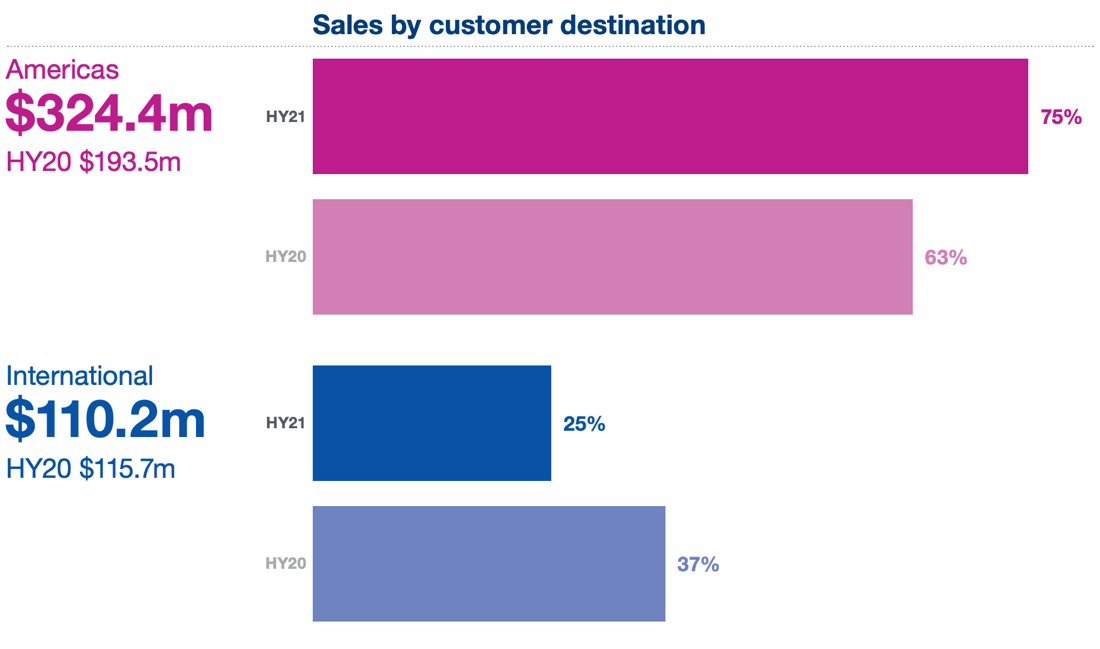
Results Highlights

Design Group
Our Business at a Glance
We’re all around the world
We operate globally, with 11,000 customers selling our products through over 210,000 stores across more than 80 countries, we enjoy considerable market presence around the world.
Focused on our five major product categories of Celebrations, Gifting, Craft & creative play, Stationery and ‘Not-for-resale’ consumables, we leverage our Group size and expertise whilst retaining local market knowledge and relationships through our local businesses.


Design Group
Watch: Half Year Presentation
IG Design Group Plc