Design Group 2023 Half Year Results
An update on helping people create and celebrate the good things in life. View full result highlights and announcement below.

Download: 2023 Half Year Results Announcement (PDF)
Download: 2023 Half Year Report (PDF)
Download: 2023 Half Year Results Presentation (PDF)
Watch: 2023 Half Year Results Presentation
Click to jump to your area of interest or scroll to read full report summary
Introduction
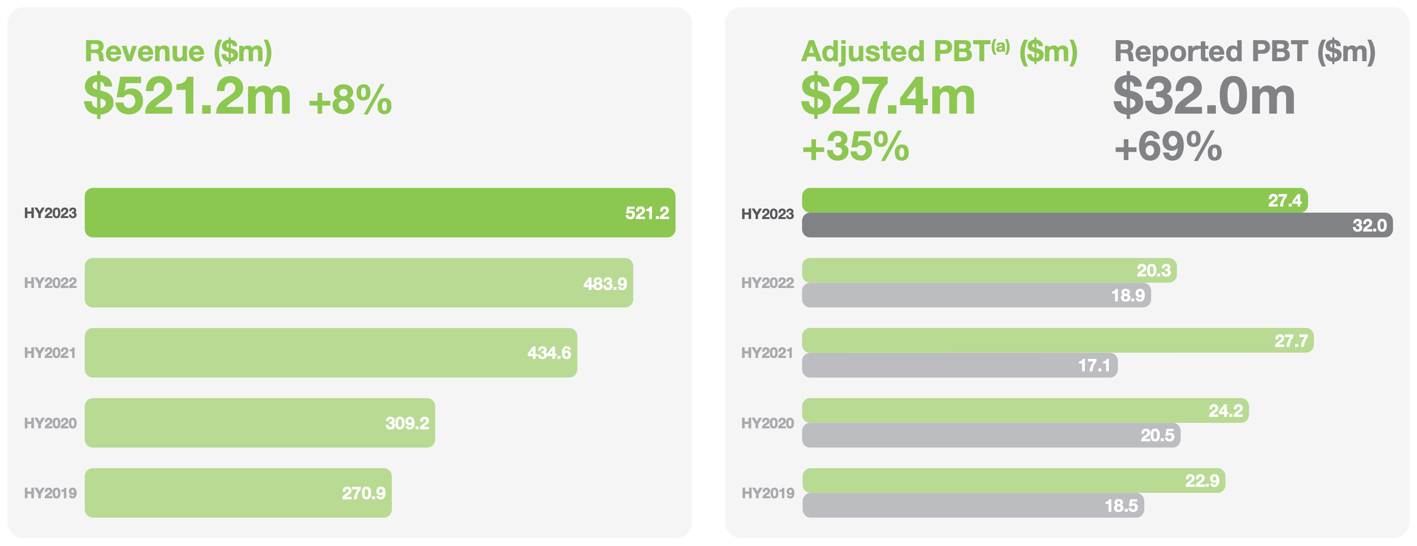
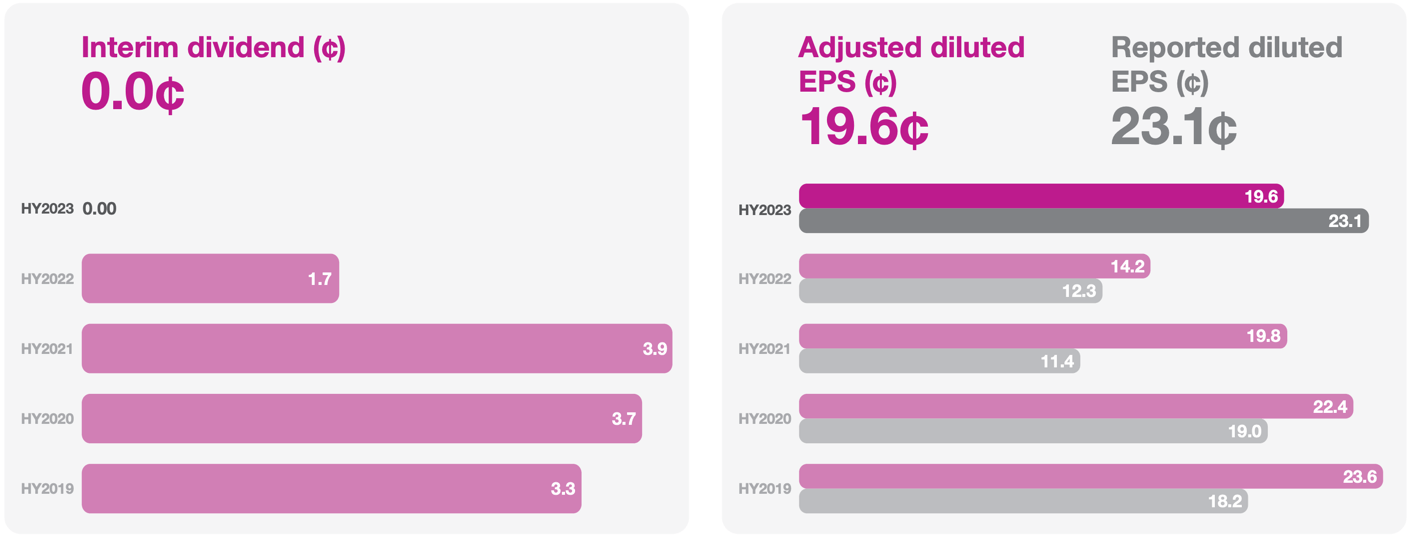
Results Highlights
Our Business at a Glance
Downloads
Design Group
Introduction
Introduction from Stewart Gilliland
Our strong performance during this period has undoubtedly benefitted from customers seeking to avoid last year’s supply chain issues by ordering earlier, but also from recognising our high level of service and commitment to them. Pleasingly, the restructuring and simplification of the DG Americas business is progressing well. The turnaround of the Group has commenced and is expected to now gather momentum following the recently announced senior leadership appointments. Looking forward, the development of a growth-focused strategy alongside the establishment of a more resilient business model will benefit shareholders.
While the challenging external backdrop and the uncertain impact of sustained cost inflation on consumer sentiment in some markets does temper our optimism notwithstanding the strong start to this year, the Group has once again proved that it has extremely strong relationships with its customers and there is ongoing demand for our products.
Stewart Gilliland
Interim Executive Chair

Design Group
Watch: 2023 Half Year Results Presentation
Design Group
Results Highlights

Design Group
Our Business at a Glance
Revenue by customer destination
Americas$391.2m
HY2022: $356.6m
-
HY2023:
75%
-
HY2022:
74%
International$130.0m
HY2022: $127.3m
-
HY2023:
25%
-
HY2022:
26%
Revenue by season
Christmas
-
HY2023:
50%
-
HY2022:
46%
Everyday
-
HY2023:
45%
-
HY2022:
50%
Minor seasons
-
HY2023:
5%
-
HY2022:
4%
Revenue by product
Celebrations
-
HY2023:
64%
-
HY2022:
64%
Craft & creative play
-
HY2023:
15%
-
HY2022:
15%
Gifting
-
HY2023:
9%
-
HY2022:
9%
‘Not-for-resale’ consumables
-
HY2023:
6%
-
HY2022:
7%
Stationery
-
HY2023:
6%
-
HY2022:
5%
Revenue by source
Sourced
-
HY2023:
70%
-
HY2022:
72%
Manufactured in-house
-
HY2023:
30%
-
HY2022:
28%
Download