Design Group 2022 Full Year Results
An update on helping people create and celebrate the good things in life. View full result highlights and announcement below.

Download: 2022 Annual Report
Download: 2022 Full Year Results Announcement (PDF)
Download: Full Year Results Presentation 2022 (PDF)
What’s Covered
Click to jump to your area of interest or scroll to read full report summary
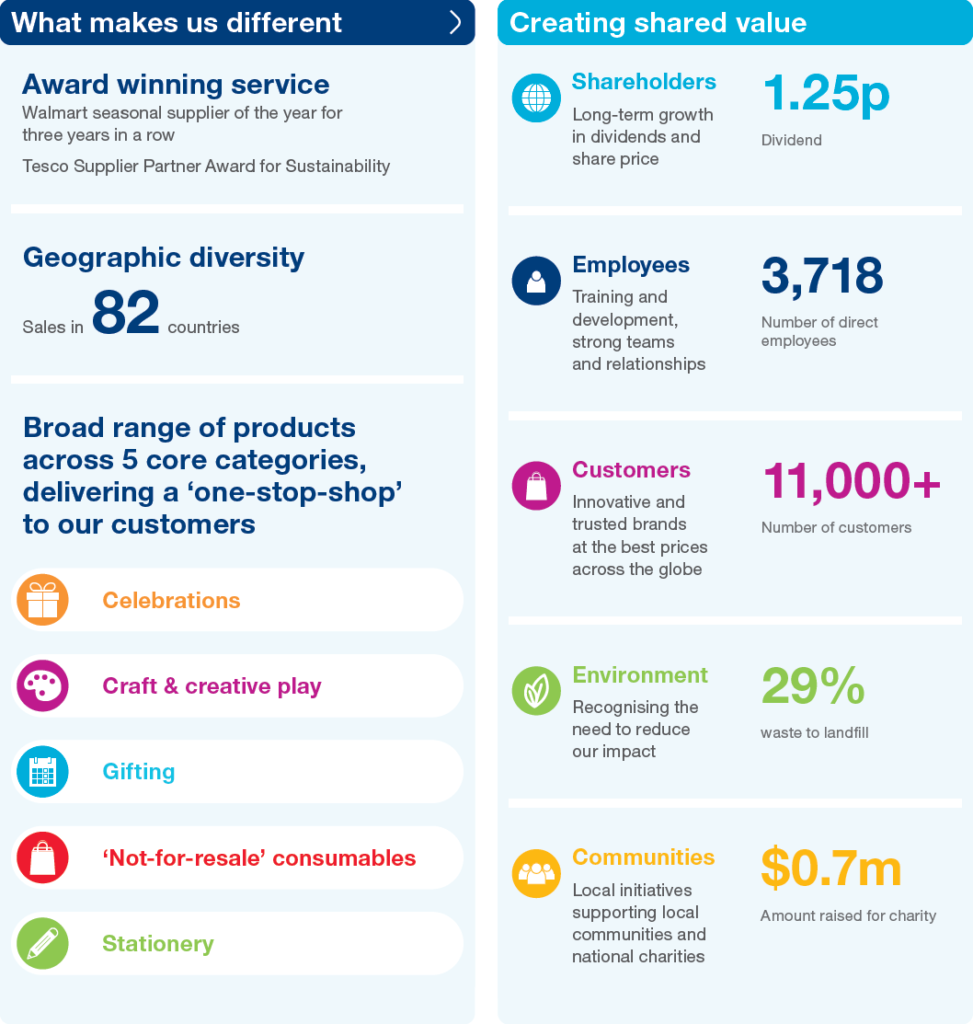
Creating Shared Value
Watch: 2022 Results Presentation
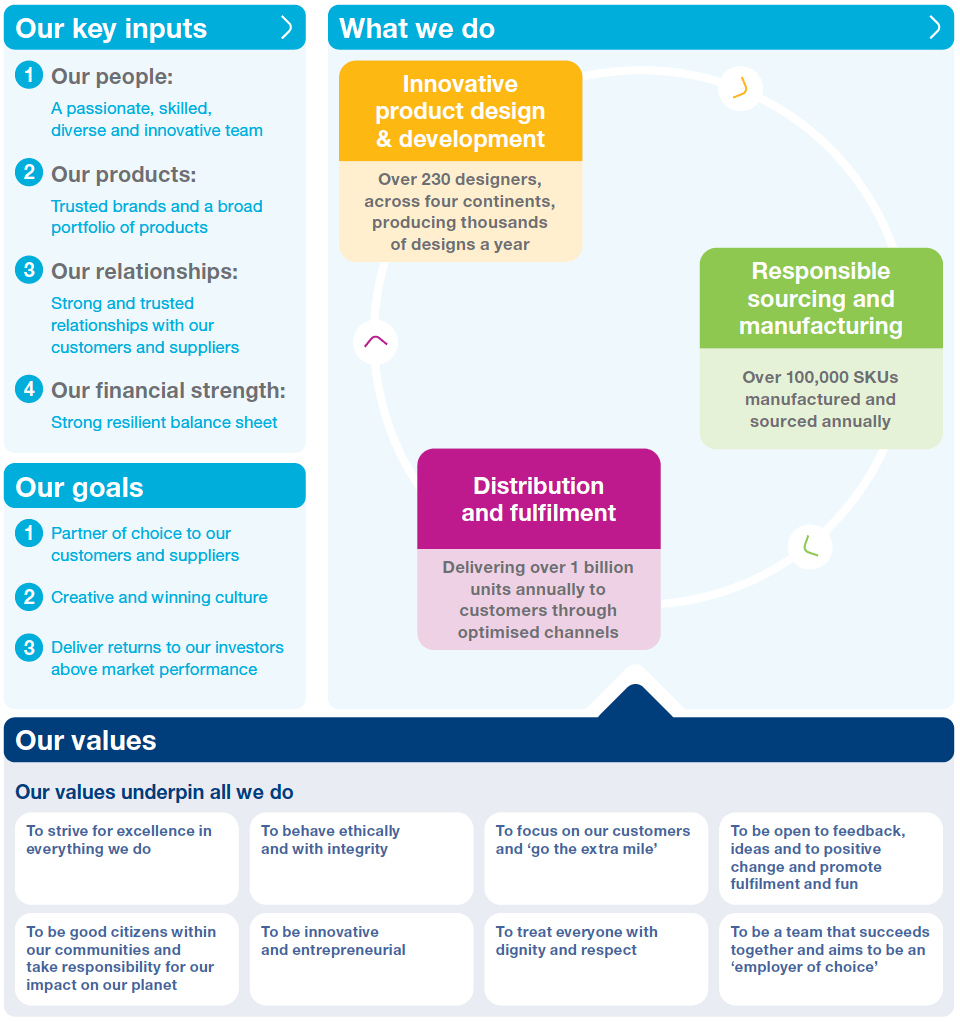
Designed to Succeed
Results Highlights
Our Business at a Glance
Downloads
Overview
Creating Shared Value
Design Group
Watch: 2022 Results Presentation with Q&A
Design Group
Designed to Succeed
Our Commitment to Shareholders
Results Highlights
Delivering growth
Adjusted earnings per share
Aim to deliver double-digit three year compound annual growth
-
2018:
26.0
-
2019:
33.4
-
2020:
33.0
-
2021:
22.2
-
(7.7)
2022:
Adjusted earnings/(loss) per share(a), (b) (cents)FY2022 reported diluted (loss)/earnings per share (3.3c) (FY2021: 8.4c)
Revenue
FY2021: $873.2m
Adjusted (loss)/profit before tax(a)
FY2021: $32.8m (restated)(b)
Reported profit before tax
FY2021: $14.7m
Generating cash
Average leverage
Sustain long-term average leverage below 2.0x
-
2018:
1.6x
-
2019:
1.4x
-
2020:
0.9x
-
2021:
0.0x
-
2022:
1.0x
Average leverage(a), (b)
Adjusted EBITDA(a)
FY2021: $73.3m (restated)(b)
Average bank debt
FY2021: $2.2m
Improving returns
Dividend
Trend upwards until 2.5x covered (40% pay out)
-
2018:
6.00
-
2019:
8.50
-
2020:
8.75
-
2021:
8.75
-
2022:
1.25
2022: 1.25 Dividends (pence)
Cash conversion(a)
FY2021: 93.2% (restated)(b)
Return on capital employed(a)
FY2021: 15.8% (restated)(b)
Design Group
Our Business at a Glance
Revenue by customer destination
Americas $665.1m
2021: $621.7m
-
2022:
69%
-
2021:
71%
International $300.0m
2021: $251.5m
-
2022:
31%
-
2021:
29%
Revenue by source
Sourced
-
2022:
67%
-
2021:
67%
Manufactured In-house
-
2022:
33%
-
2021:
33%
Revenue by product
Celebrations
-
2022:
63%
-
2021:
60%
Craft & creative play
-
2022:
16%
-
2021:
18%
Gifting
-
2022:
10%
-
2021:
12%
‘Not-for-resale’ consumables
-
2022:
7%
-
2021:
6%
Stationery
-
2022:
4%
-
2021:
4%
Revenue by season
Everyday
-
2022:
53%
-
2021:
50%
Christmas
-
2022:
40%
-
2021:
43%
Minor
-
2022:
7%
-
2021:
7%